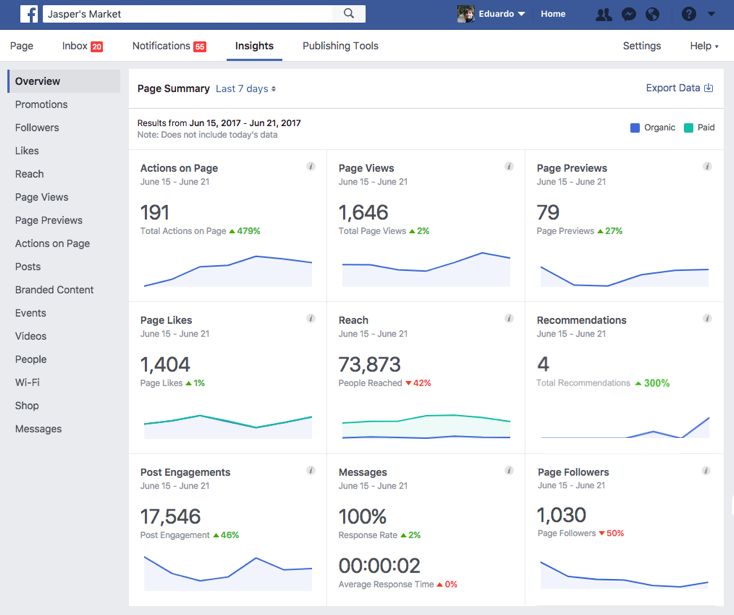
Great campaigns are powered by great insights. As people interact with businesses in new ways, marketers need to better understand actions driven by their online presence. We’ve heard feedback from businesses that they want more transparency and understanding around their Facebook performance. As part of our commitment to measurement, about every month or so we’ll release new metrics so that businesses have better ways to measure outcomes, all in one place. We’ll begin the series of metrics updates with features that capture new kinds of interactions with your ads or Page.
More Visibility On Ad Interactions
Getting visitors to your website or app greatly expands the potential for new customers. But slow-loading mobile sites or poor connections quickly cause many people to lose interest if they’re waiting for a page to load after clicking on an ad. To give you a better sense of the number of visitors that arrive to your website after a link click on an ad, we’re beginning to rollout a new metric called landing page views. This new metric will help businesses realize the importance of optimizing for a better mobile web experience. Businesses will be able to choose to optimize for landing page views when they use the traffic objective, finding more people who will actually arrive on their landing page after clicking on their ad.
We’ve also heard that businesses want more clarity around whether or not someone who clicks on an ad is a new or returning customer. The pre-impression activity breakdown is a new metric we’re introducing over the coming weeks that shows the number of people who have previously engaged with an advertiser’s website or app versus new visitors. We make the determination based on whether a site in recent weeks fired a pixel or triggered an app event associated with a business. Pre-impression breakdown is particularly helpful for businesses running dynamic ads for broad audiences, where the audiences expand beyond their own customers, and where ad creatives are generated dynamically based on associated product recommendations.
New Reporting On Page Interactions
We’re introducing three new reporting metrics to give Page owners a more complete understanding of how people learn about and interact with their businesses. These metrics will roll out to Pages over the coming weeks and can be viewed within the “overview” tab of Page Insights on desktop.

- Follows: rather than only showing the total number of follows a business has, we’re now breaking out the number of follows a Page gains or loses over time, insights into where follows happen, follower demographics, and a breakdown of organic and paid follows. You can visit the Help Center for a refresher on understanding follows and likes.
- Previews: people may come across your Page’s information without actually clicking on the Page. We’ll now show you the number of people who saw your Page’s information when hovering over your Page’s name on desktop.
- Recommendations: people are already using recommendations as a way to get advice from friends, family, and local Groups on Facebook. We’ll now start showing the number of times a Page has been included under someone’s recommendation as a suggestion from friends and family.
We’ll continue to surface more metrics over the coming months as we get feedback and uncover new ways to provide actionable insights.


