
Today we’re publishing the Community Standards Enforcement Report for the second quarter of 2021. This report provides metrics on how we enforced our policies from April through June. This is our 10th report and some of our long-term trends include:
- Prevalence of hate speech has decreased for three quarters in a row since we first began reporting it. This is due to improvements in proactively detecting hate speech and ranking changes in News Feed.
- Hate speech content removal has increased over 15X on Facebook and Instagram since we first began reporting it.
- Our proactive rate (the percentage of content we took action on that we found before a user reported it to us) is over 90% for 12 out of 13 policy areas on Facebook and nine out of 11 on Instagram.
- We now include 13 policy areas on Facebook and 11 on Instagram, and have added new metrics on appeals, restores, and prevalence.
In addition to our Community Standards Enforcement Report, this quarter we’re also sharing:
- The newly released Widely Viewed Content Report
- Ongoing updates on our efforts to promote reliable information about COVID-19 and vaccines and reduce harmful misinformation
We’re committed to sharing meaningful data so we can be held accountable for our progress, even if the data shows areas where we need to do better.
Today, we’re also releasing the first in a series of reports that will give an overview of the most widely-viewed content in Facebook’s News Feed, starting with the top 20 most viewed domains, links, Pages and posts in the US. These reports are public in the Transparency Center and we will include them with each quarterly Community Standards Enforcement Report going forward.
Promoting Reliable Information and Reducing Harmful Misinformation About COVID-19
COVID-19 is still a major public health issue, and we are committed to helping people get authoritative information, including vaccine information. We continue to remove harmful COVID-19 misinformation and prohibit ads that try to exploit the pandemic for financial gain. Since the start of the pandemic through June:
- We removed more than 20 million pieces of content from Facebook and Instagram globally for violating our policies on COVID-19-related misinformation.
- We have removed over 3,000 accounts, pages, and groups for repeatedly violating our rules against spreading COVID-19 and vaccine misinformation.
- We displayed warnings on more than 190 million pieces of COVID-related content on Facebook that our third-party fact-checking partners rated as false, partly false, altered or missing context, collaborating with 80 fact-checking organizations in more than 60 languages around the world. When they rate a piece of content with one of these ratings, we add a prominent label warning people before they share it and show it lower in people’s feed.
We’ve provided authoritative information to help improve vaccine acceptance, connecting 2 billion people to resources from health experts through our COVID-19 Information Center and educational pop-ups on Facebook and Instagram and helping 4 million people in the US alone access vaccines through our vaccine finder tool.
We know from public health research that people are more likely to get vaccinated if they see others in their community doing so. In countries where vaccines are available to most people, we ramped up our efforts to show when friends and neighbors share their support for vaccines through profile frames and stickers.
- Since the beginning of the pandemic, more than 18 million people globally have used Facebook profile frames supporting vaccines.
- More than 25% of people globally on Facebook have already seen someone use the UNICEF COVID-19 vaccine profile frames.
- Over 29% of people globally on Instagram have seen someone use a COVID-19 vaccine sticker.
- Instagram COVID-19 vaccine stickers have been used by more than 7.6 million people globally.
For people in the US on Facebook, vaccine hesitancy has declined by 50%. Globally, we have also seen vaccine acceptance rising. For example, our COVID-19 Trends and Impact Survey data which we conduct in partnership with Carnegie-Mellon and University of Maryland has since the beginning of the year shown vaccine acceptance rising by 35 percent in France, 25 percent in Indonesia, and 20 percent in Nigeria.
Community Standards Enforcement Report Highlights
Progress on Hate Speech
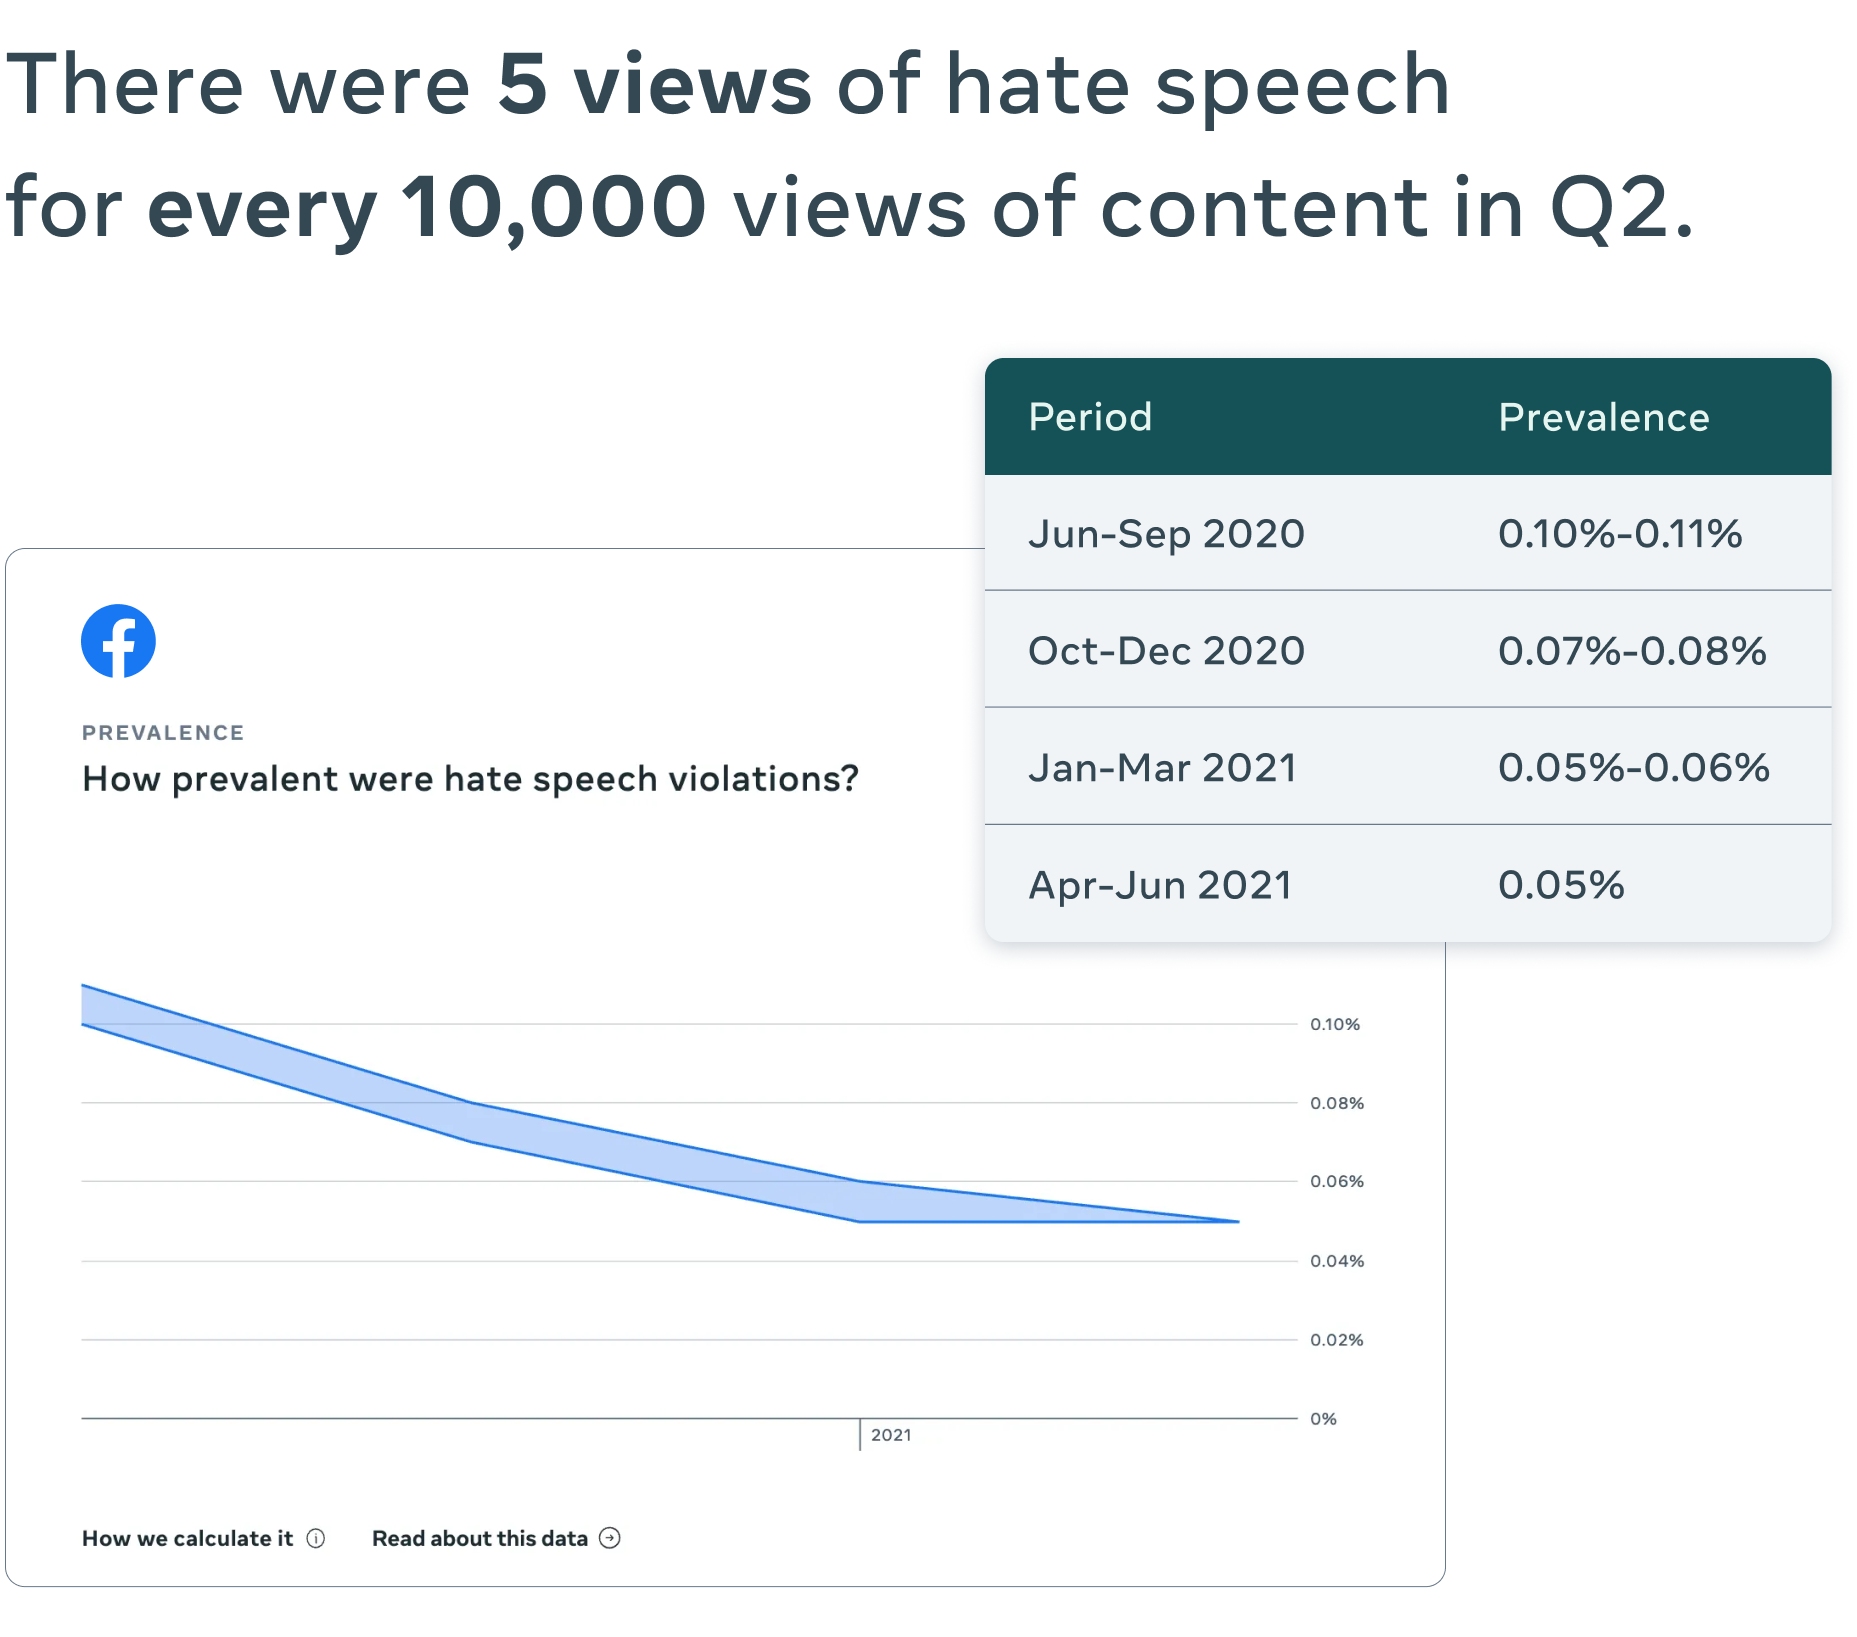
Prevalence of hate speech on Facebook continued to decrease for the third quarter in a row. In Q2, it was 0.05%, or 5 views per 10,000 views, down from 0.05-0.06%, or 5 to 6 views per 10,000 views in Q1.
We removed 31.5 million pieces of hate speech content from Facebook, compared to 25.2 million in Q1, and 9.8 million from Instagram, up from 6.3 million in Q1. This is due to continued improvement in our proactive detection. Our investments in AI enable us to detect more kinds of hate speech violations on Facebook and Instagram. This technology helps us enforce our policies across billions of users and multiple languages. Steady, continuous AI improvements and advancements, such as the Reinforcement Integrity Optimizer (RIO), enable our AI models to spot hate speech using real-world data and improve over time.
Updates in Child Safety
Keeping children safe on our apps is critical. Previously, we reported one metric, child nudity and sexual exploitation of children. In our latest report, we’ve added more data and created two new reporting categories under the broader topic of child endangerment: 1) nudity and physical abuse and 2) sexual exploitation.
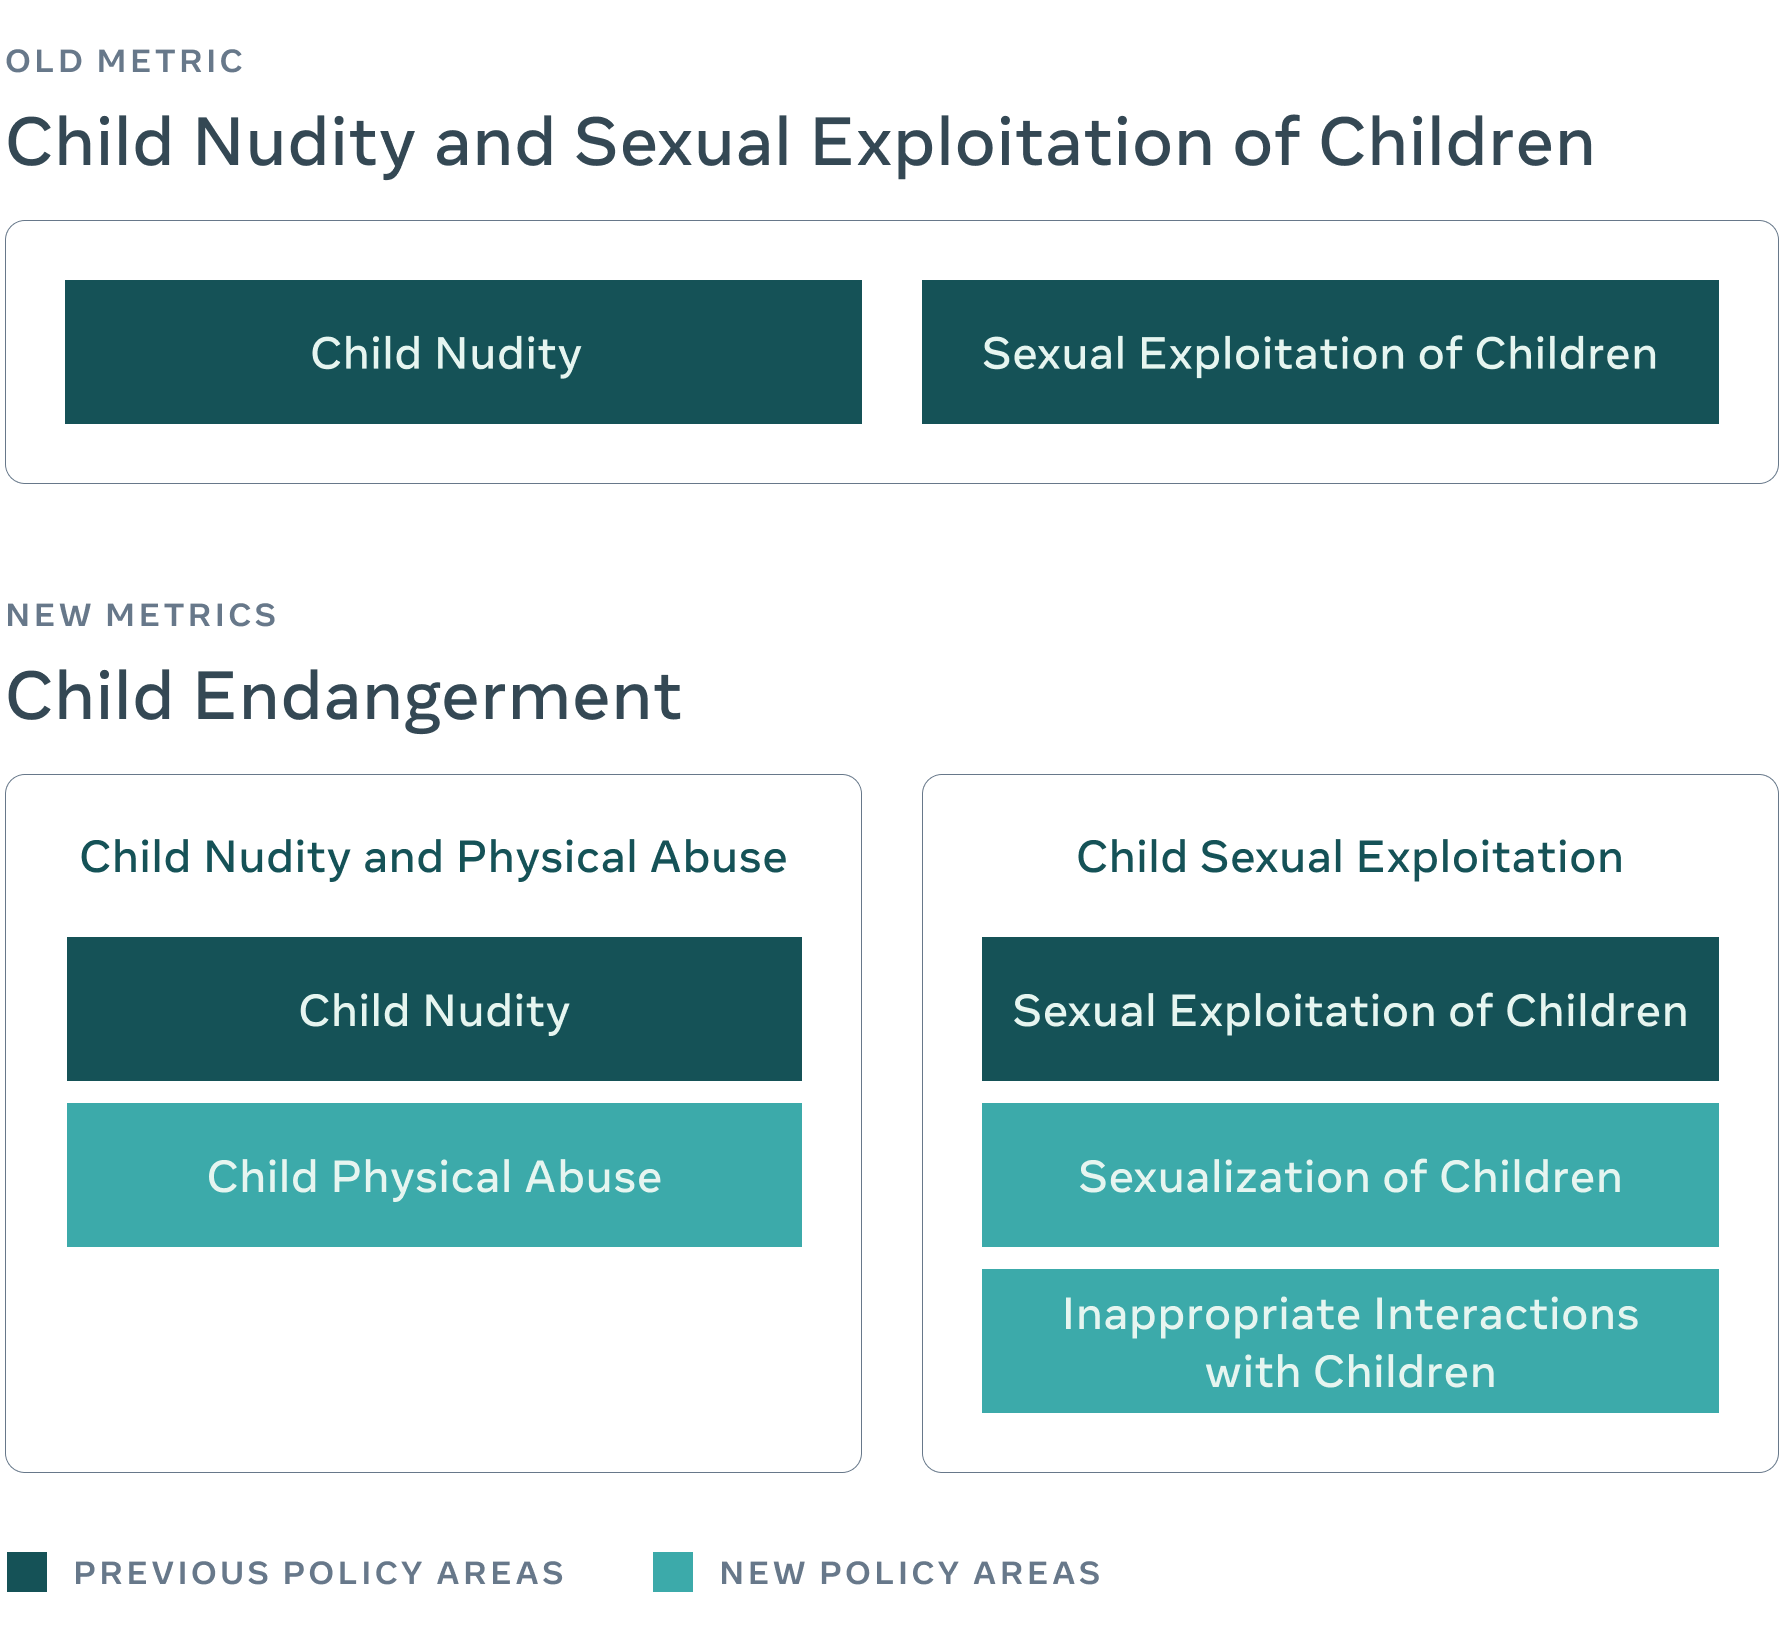
We changed this to provide a more detailed, transparent overview of our efforts in this space to child safety experts, academics and the general public.
- Child nudity and physical abuse content we took action on:
- On Facebook: 2.3 million with a proactive rate over 97%
- On Instagram: 458,000 with a proactive rate of over 95%
- Child sexual exploitation content we took action on:
- On Facebook: 25.7 million with a proactive rate of over 99%
- On Instagram: 1.4 million with a proactive rate of over 96%
In Q2 2021, we improved our proactive detection technology on videos and expanded our media-matching technology on Facebook, allowing us to remove more old, violating content. Both enabled us to take action on more violating content.
Recent Trends
In addition to new categories and ongoing improvements in reducing prevalence, we saw steady progress across many problem areas.
On Facebook in Q2 we took action on:
- 6.2 million pieces of organized hate content, compared to 9.8 million pieces in Q1 2021 — this marks a return to pre-Q1 levels as we update our proactive detection technology
- 16.8 million pieces of suicide and self-injury content, compared to 5.1 million pieces in Q1 2021 — due to a technical fix we made that allowed us to go back and catch violating content we missed
- 34.1 million pieces of violent and graphic content, compared to 30.1 million pieces in Q1 2021
On Instagram in Q2 we took action on:
- 367,000 of organized hate content, up from 325,000 in Q1 2021
- 3 million pieces of suicide and self-injury content, up from 2.6 million in Q1 2021
- 7.6 million pieces of violent and graphic content, compared to 5.5 million pieces in Q1 2021


