Update on November 4, 2022 at 1:15PM PT:
Our latest analysis shows that less than 3% of the content people in the US see in their Facebook Feed is political in nature, down from 6% when measured in 2020.
Originally published on November 10, 2020 at 2:30PM PT:
I would like to provide a little more detail on what people have seen on Facebook leading up to the election as there are questions out there about this.
The vast majority of what people in the US see on Facebook is in their News Feed. Most of the content people see there, even in an election season, is not about politics. In fact, based on our analysis, political content makes up about 6% of what you see on Facebook. This includes posts from friends or from Pages (which are public profiles created by businesses, brands, celebrities, media outlets, causes and the like).
For example, Halloween had twice the increase in posting we saw on Election Day, even though Facebook prompted people at the top of their News Feed (a number of times) to post about voting.
Using Facebook’s own tool, CrowdTangle, you can retrieve data about which Page posts are engaged with the most. This tool was built to help people get some idea of what content will get likes, comments and reshares. But it is not designed to show what is being seen the most.
Ranking top Page posts by reactions, comments, etc. doesn’t paint a full picture of what people actually see on Facebook. There are at least two limitations in using CrowdTangle to understand what works on Facebook more broadly than the specific questions the tool was built to answer:
- Likes and comments don’t equate to reach. Our ranking models include much more than just engagement. For example, they can include survey results, like when we ask people whether a post was worth their time.
- Page posts are a minority of what goes on in our ecosystem (platform).
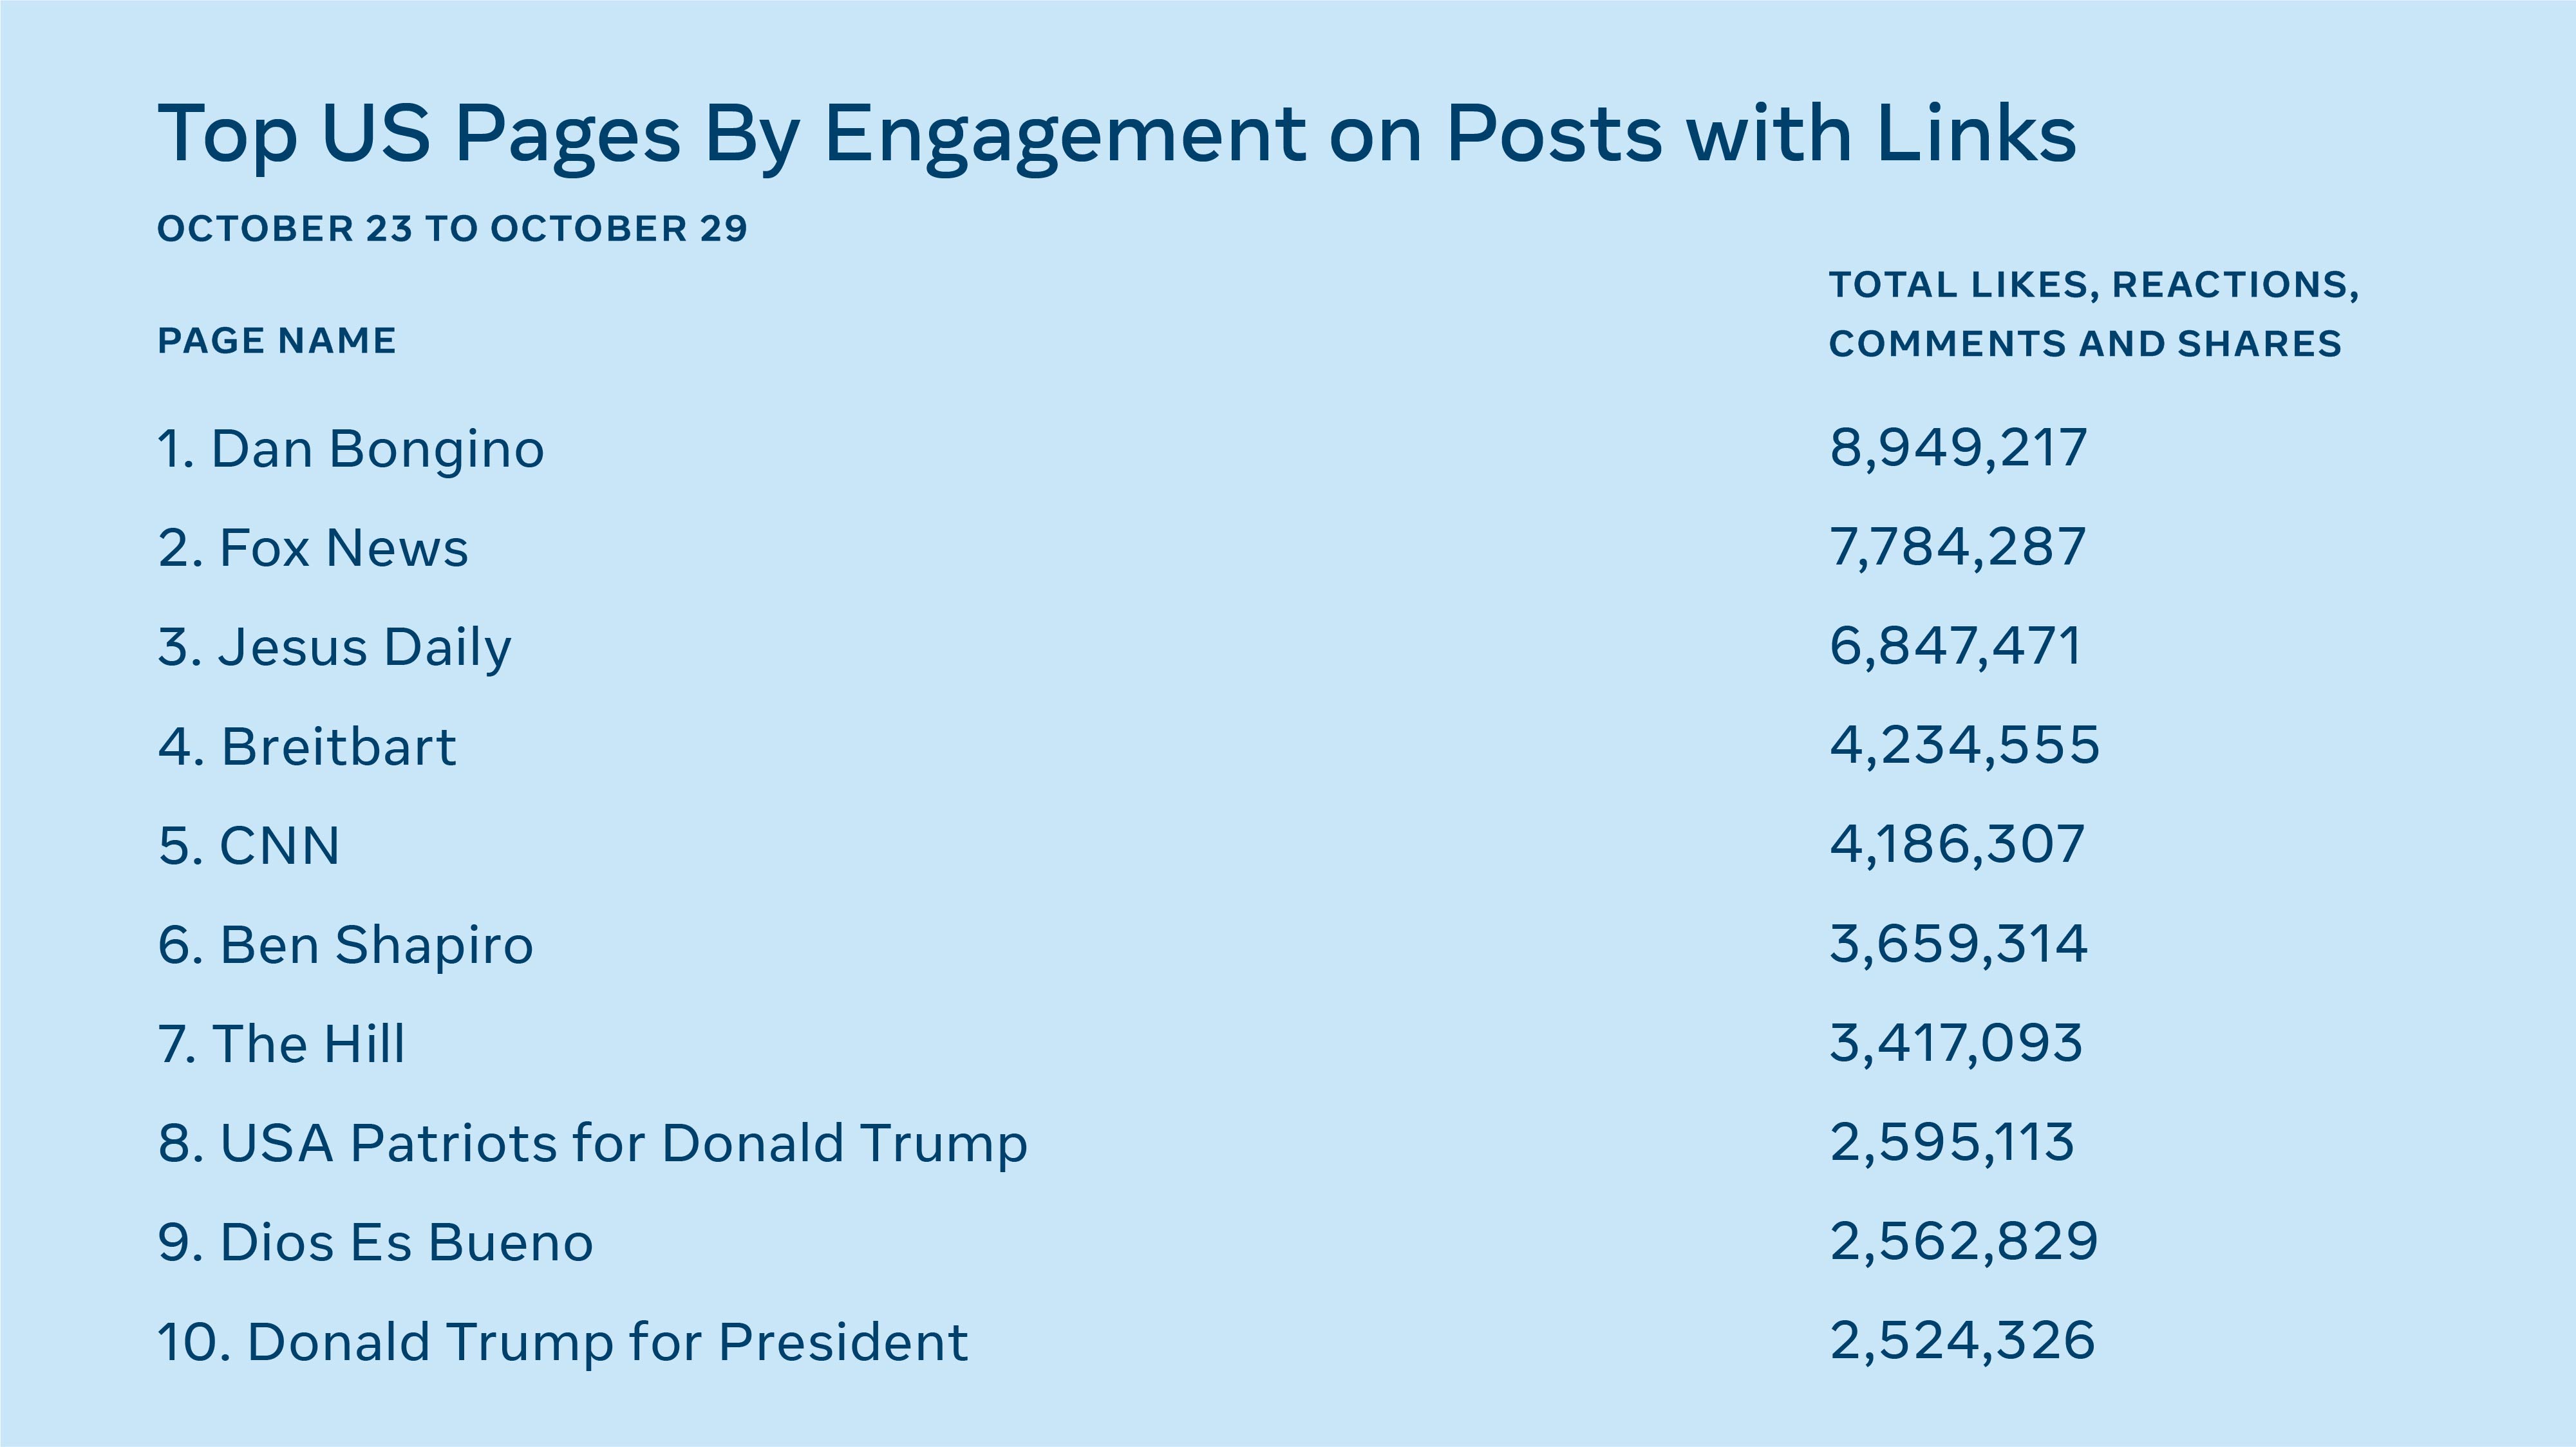
Much of the public discussion around what performs best on Facebook focuses on posts from Pages with the most engagement and which also contain links to other content elsewhere. Here is a popular example: https://twitter.com/facebookstop10. But this is a subset of Page posts and I don’t think that these lists are fully representative of the Pages ecosystem (even if you’re looking only at engagement).
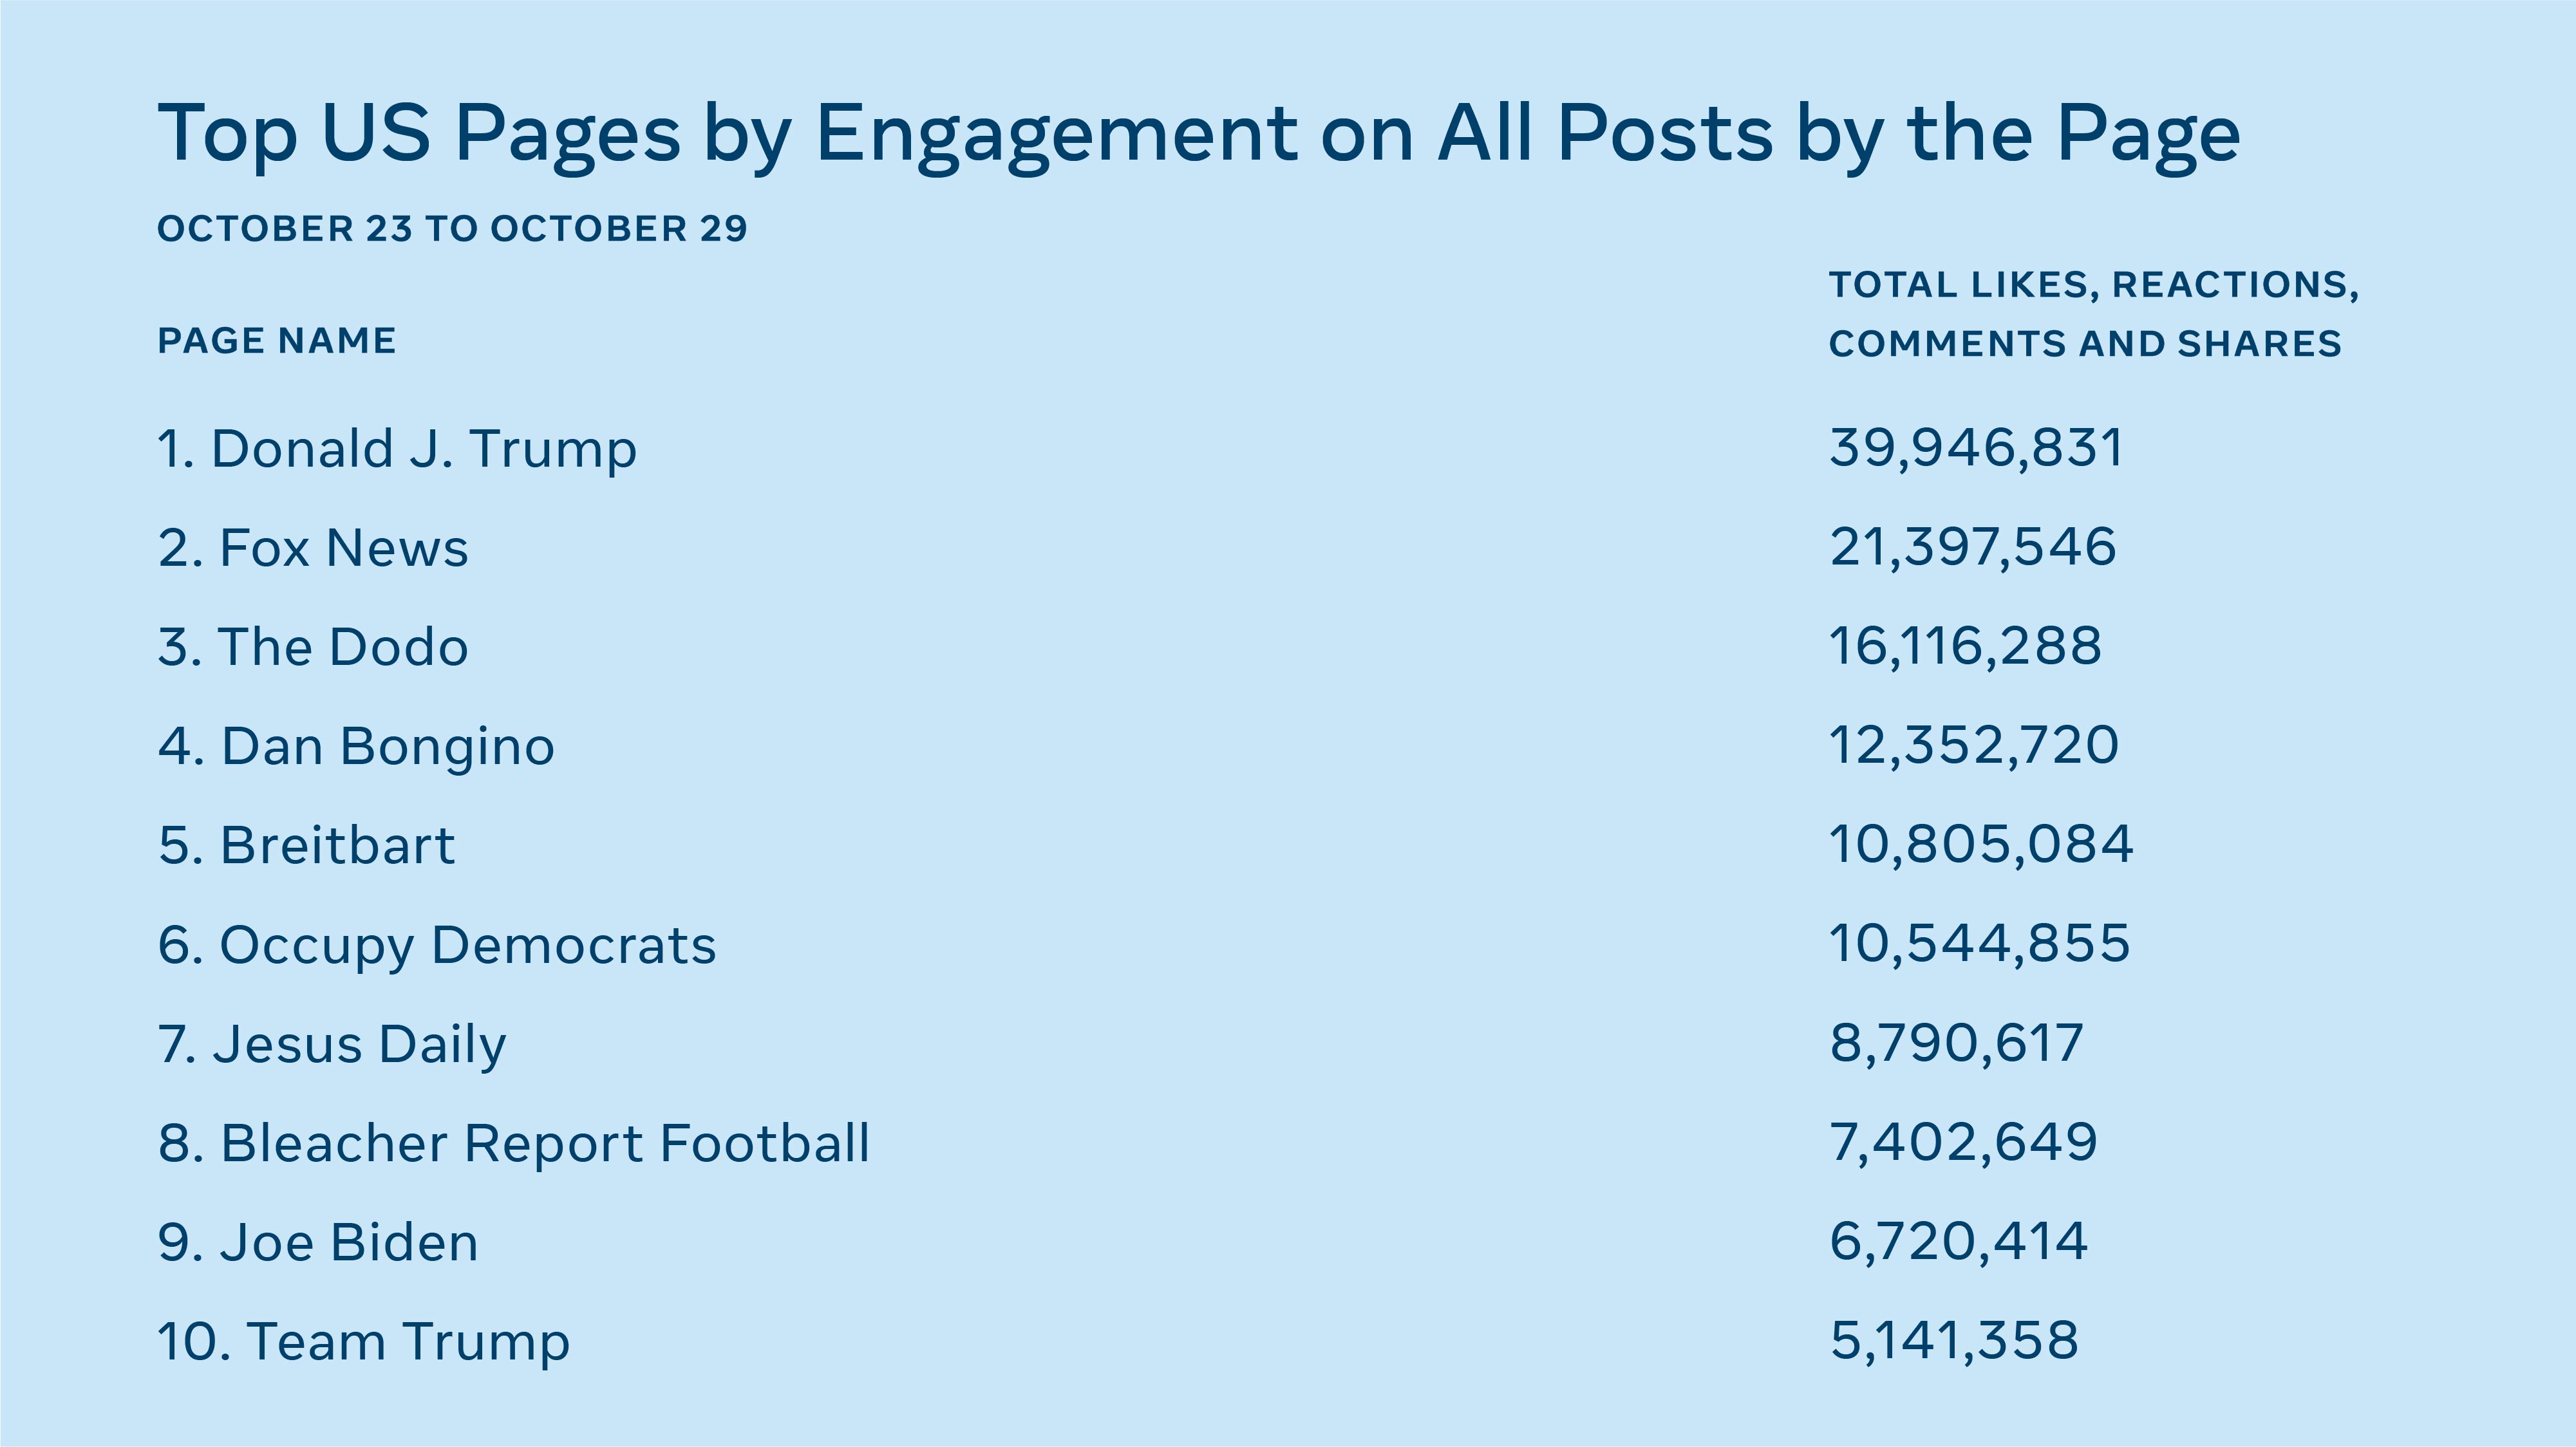
If you look at the top performing US-based Pages based on their global engagement with all posts (and not just posts with web links), you get quite a different list. For example: Joe Biden, Occupy Democrats and Donald J Trump jump into the top ten, while Ben Shapiro and USA Patriots for Donald Trump drop out of the top ten.
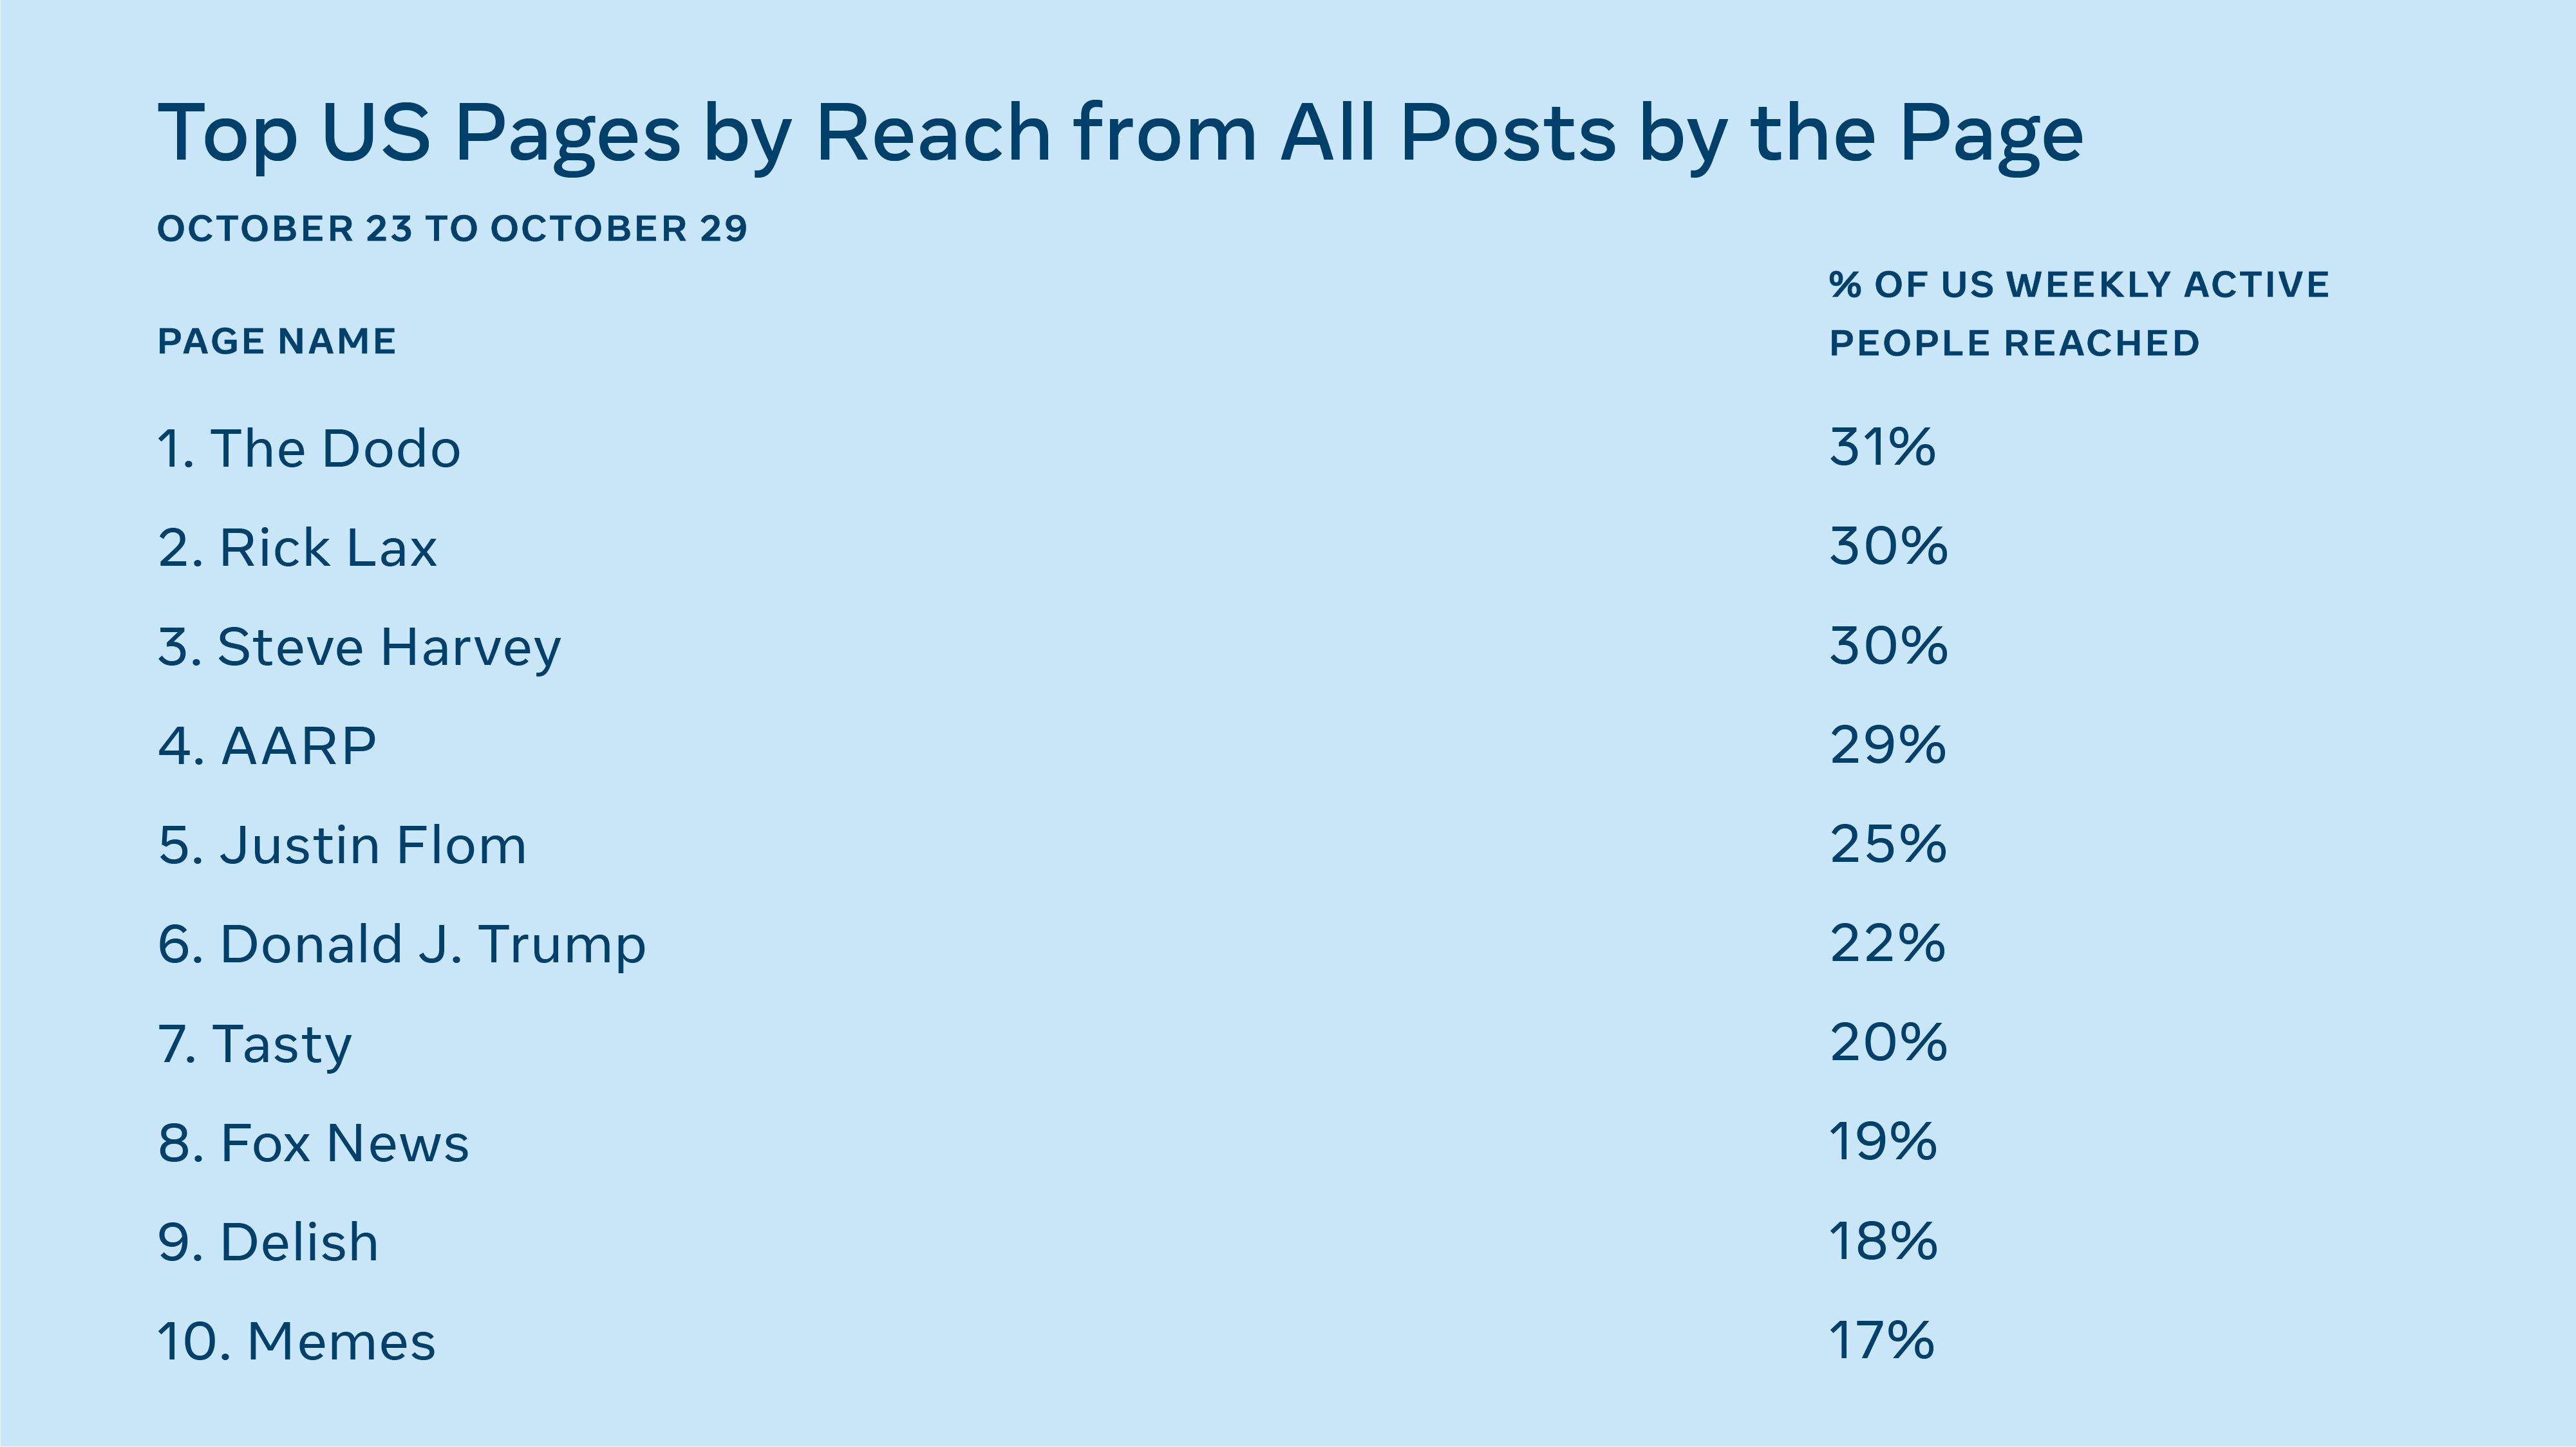
To show the full picture though, we think it’s important to look at how many people actually see the content (vs. liking or sharing a piece of content). We call this reach. We wanted to share some additional data to help round out the picture.
Here are lists of the US news publishers and the US-based Pages (based on the domain in their URL) who reached the most people in the US in the week following the last presidential debate. As you can see, the publishers and Pages with the most reach are two very different lists. These two groups are also very different from the Pages with the most engagement, as shown in the first list above.
Engagement does not predict reach. (You can find additional explanation in these articles about personalization in News Feed, public comments and reducing the spread of problematic content.) We believe this list is more indicative of what people actually see on Facebook, and the publishers listed are more indicative of which outlets people see on Facebook dealing with politics.

Overall we believe this paints a more complete picture than the CrowdTangle data alone, which was never supposed to show the reach of content on Facebook. We believe this shows the actual balance of what people saw on Facebook in the week before the election, which we think is a reasonable (but not perfect) reflection of the election in general.
We have also seen public comments on changes to the Pages that were getting the most engagement in the period just after the election results were called. Some Pages like the New York Times, NPR, CNN and the Washington Post saw really big spikes in engagement.
Some had massive spikes on the day election results were announced, but generally declined after the race was called for Joe Biden. A smaller effect appears to have been due to the temporary measures we put in place to address potential misinformation and delegitimizing content on our platform related to the election.
We are now seeing these lists return to a state similar to what we saw before the election while our temporary measures remain in place. We believe this means that the hypothesis around big spikes in engagement is likely the most important factor, as the other measures mentioned are ongoing.
One point I found heartening in preparing this data was this quote from one of our data scientists. Following the announcement of a winner, ‘Americans applying heart reactions on political content were off the charts, while angry reactions were closer to baseline.’ It’s possible to have a spike in positivity without having a corresponding spike in negativity.
There has been a lot of interest in Facebook’s impact on civic discourse and reasonable requests for us to share more data so it can be studied more fully. Obviously, this post is not meant to be a perfect analysis. In response to those requests we are partnering through the Facebook Open Research and Transparency (FORT) project with a group of researchers from a number of preeminent universities. They are leading a series of privacy-protected experiments and conducting analysis into what happened on Facebook during this election cycle. We hope the first research papers will be published next year and will provide a better understanding than the rough analysis we are showing here.
Following Cambridge Analytica, it is clear how careful we need to be about partnering with researchers and giving them access to data. It is also clear that following the last presidential election we need to have independent research to understand our role in elections. This partnership through FORT is a step in that direction and (although nothing is perfect) one I am really proud of. I hope it can serve as a base from which we can build for the future, to thread the needle on the needs of privacy and research.


