By Guy Rosen, VP Integrity
Today, we’re publishing our third Community Standards Enforcement Report, covering Q4 2018 and Q1 2019. This report adds a few additional data points:
What’s New in the Third Edition
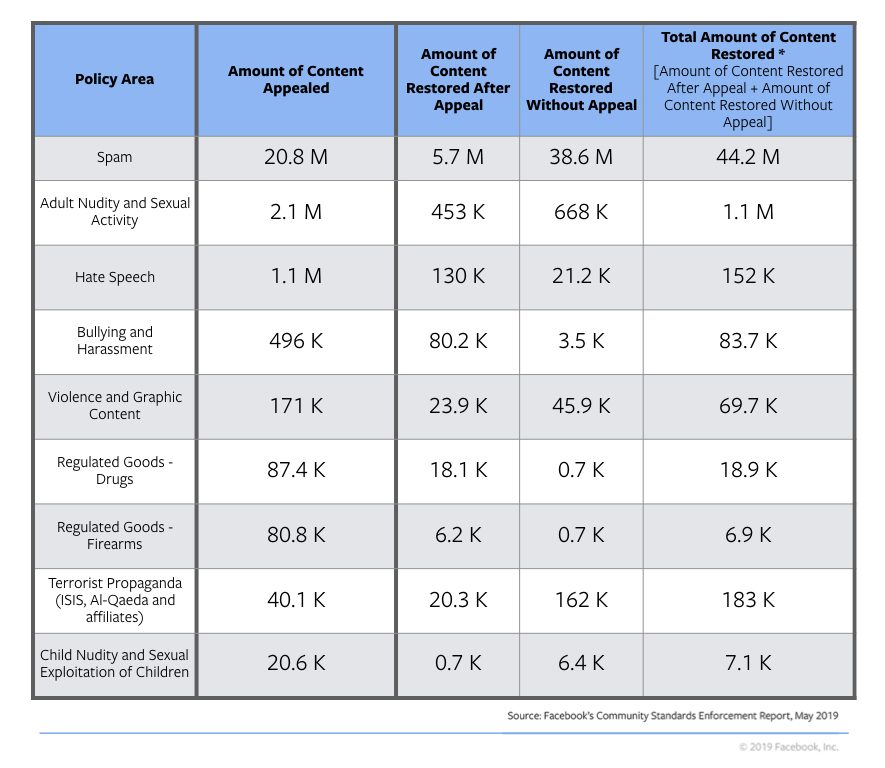
- Data on appeals and content restored: For the first time, we’re including how much content people appealed and how much content was restored after we initially took action.
- Data on regulated goods: In addition to the eight policy areas covered in the second edition of the report (November, 2018), we are now detailing how we’re doing at removing attempts at illicit sales of regulated goods — specifically, firearm and drug sales.
In total, we are now including metrics across nine policies within our Community Standards: adult nudity and sexual activity, bullying and harassment, child nudity and sexual exploitation of children, fake accounts, hate speech, regulated goods, spam, global terrorist propaganda and violence and graphic content.
How to Make Sense of the Numbers
The key metrics in our report, which together track how we are doing at enforcing our Community Standards, are:
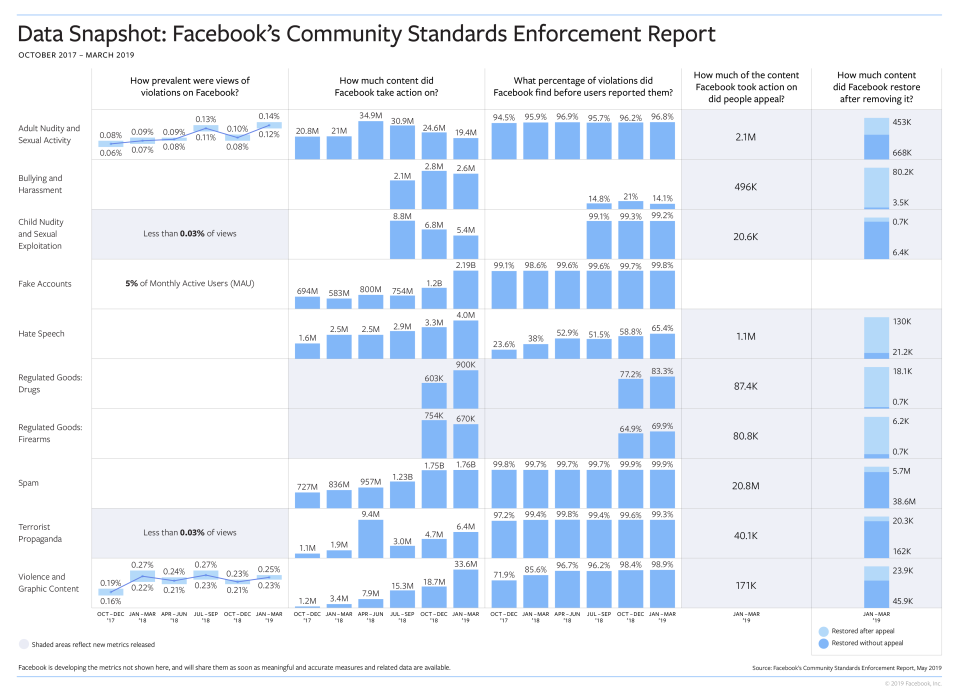
Prevalence: The frequency at which content that violates our Community Standards was viewed. We care most about how often content that violates our policies is actually seen by someone. While content actioned describes how many things we took down, prevalence describes how much we haven’t identified yet and people may still see. We measure it by periodically sampling content viewed on Facebook and then reviewing it to see what percent violates our standards.
This metric is currently available for adult nudity and sexual activity, for violence and graphic content, and for fake accounts:
- We estimated for every 10,000 times people viewed content on Facebook, 11 to 14 views contained content that violated our adult nudity and sexual activity policy.
- We estimated for every 10,000 times people viewed content on Facebook, 25 views contained content that violated our violence and graphic content policy.
- For fake accounts, we estimated that 5% of monthly active accounts are fake.
In this report, we’re also sharing a prevalence metric for global terrorism and for child nudity and sexual exploitation for the first time. The prevalence for both areas is too low to measure using our standard mechanisms, but we are able to estimate that in Q1 2019, for every 10,000 times people viewed content on Facebook, less than three views contained content that violated each policy.
We continue to develop prevalence metrics for the policy areas we include in the report. You can learn more about how we measure prevalence here.
Content Actioned: How much content we took action on because it violated our Community Standards. Our actions include removing the content, applying a warning screen to the content, or disabling accounts. This metric reflects how much content people post that violates our policies, and how well we can identify it.
For fake accounts, the amount of accounts we took action on increased due to automated attacks by bad actors who attempt to create large volumes of accounts at one time. We disabled 1.2 billion accounts in Q4 2018 and 2.19 billion in Q1 2019. We’ll continue to find more ways to counter attempts to violate our policies and Alex Schultz explains more about how we address fake accounts in a Hard Questions blog we’ve also shared today.
Proactive Rate: Of the content we took action on, how much was detected by our systems before someone reported it to us. This metric typically reflects how effective AI is in a particular policy area.
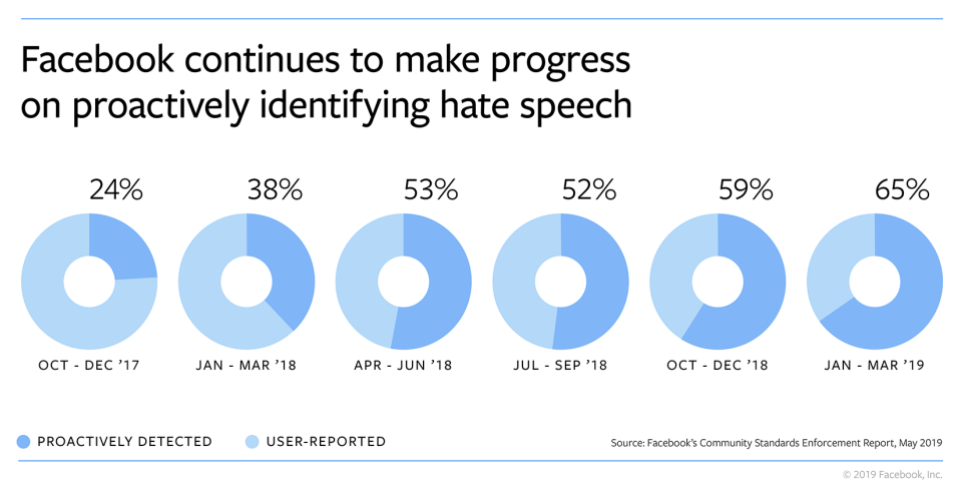
In six of the policy areas we include in this report, we proactively detected over 95% of the content we took action on before needing someone to report it. For hate speech, we now detect 65% of the content we remove, up from 24% just over a year ago when we first shared our efforts. In the first quarter of 2019, we took down 4 million hate speech posts and we continue to invest in technology to expand our abilities to detect this content across different languages and regions.
New This Report: Appeals and Correcting Our Mistakes
When we take action on a piece of content, we notify the person who posted it and in most cases offer them the ability to tell us if they think we made a mistake. In the third edition of the report, we have begun publishing data on how much content people appealed and how much content was restored after we initially took action.
Our enforcement isn’t perfect and as soon as we identify a mistake, we work to fix it. That’s why we are including how much content was restored after it was appealed, and how much content we restored on our own — even if the content wasn’t directly appealed. We restore content without an appeal for a few reasons, including:
- When we made a mistake in removing multiple posts of the same content, we can use one person’s appeal of our decision to restore all of the posts.
- Sometimes we identify an error in our review and restore the content before the person who posted it appeals.
- At other times, particularly in cases of spam when we remove posts containing links we identify as malicious, we can restore the posts if we learn the link isn’t harmful anymore.
We are including this information for Q1 2019 across each policy area in the report except for fake accounts:

The amount of content appealed in a quarter cannot be compared directly to amount of content restored within that quarter, as content restored in Q1 2019 may have been appealed in Q4 2018. Similarly, the amount of content appealed in Q1 2019 may have been actioned in Q4 2018.
You can learn more about how the appeals process works here.
New This Report: Data on Regulated Goods
We have longstanding policies against illicit drug and firearms sales. For years, we have used a range of approaches to enforce our policy such as: investigating profiles, Pages, Groups, hashtags and accounts associated with violating content we’ve already removed; blocking and filtering hundreds of terms associated with drug sales; and working with experts to stay updated on the latest tactics bad actors use to mask their activity, such as new street names for drugs.
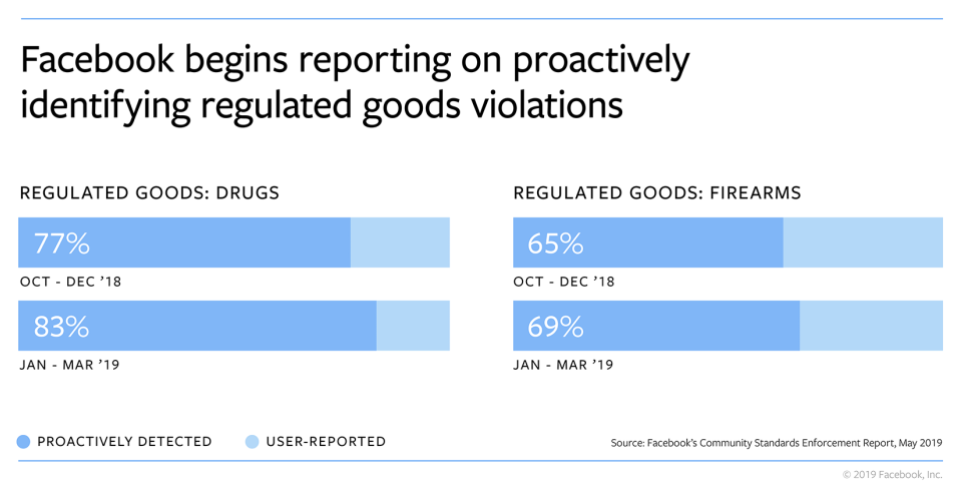
In the summer of 2018, we began trying to use AI to identify content that violates our regulated goods policies. This investment has enabled us to take action on more content and, in the majority of cases, to do so before people need to report it to us. In Q1 2019, we took action on about 900,000 pieces of drug sale content, of which 83.3% we detected proactively. In the same period, we took action on about 670,000 pieces of firearm sale content, of which 69.9% we detected proactively.
By catching more violating posts proactively, this technology lets our team focus on spotting the next trends in how bad actors try to skirt our detection.
Our Commitment to Transparency
Over the last year, we’ve taken a number of steps to be more transparent in how we develop our policies and how we measure our efforts to enforce them. When it comes to our policies, we began sharing the meeting minutes from our bi-weekly meeting where we determine updates to our policies, and now provide a change log on the Community Standards website so that each month everyone can see where exactly we’ve made updates to our policies. Additionally, as part of our efforts to enable academic research, we are awarding grants for 19 research proposals across the world to study our content policies and how online content influences offline events.
Independent external review and input is an integral component to how we improve. In that spirit, we established the Data Transparency Advisory Group (DTAG) — comprised of international experts in measurement, statistics, criminology and governance — to provide an independent, public assessment of whether the metrics we share in the Community Standards Enforcement Report are meaningful and accurate. We provided the advisory group detailed and confidential information about our enforcement processes and measurement methodologies and this week they published their independent assessment. In its assessment, the advisory group noted that the Community Standards Enforcement Report is an important exercise in transparency and that they found our approach and methodology sound and reasonable. They also highlighted other areas where we could be more open in order to build more accountability and responsiveness to the people who use our platform. These important insights will help inform our future work.
We will continue to bring more transparency to our work and include more information about our efforts so people can see our progress and hold us accountable on where we need to do more.
You can read the full report here, and find the guide here.
Downloads:
Press Call Transcript
Press Call Audio
Data Snapshot
Hate Speech Proactive Detection
Appeals Chart
Regulated Goods Proactive Detection


